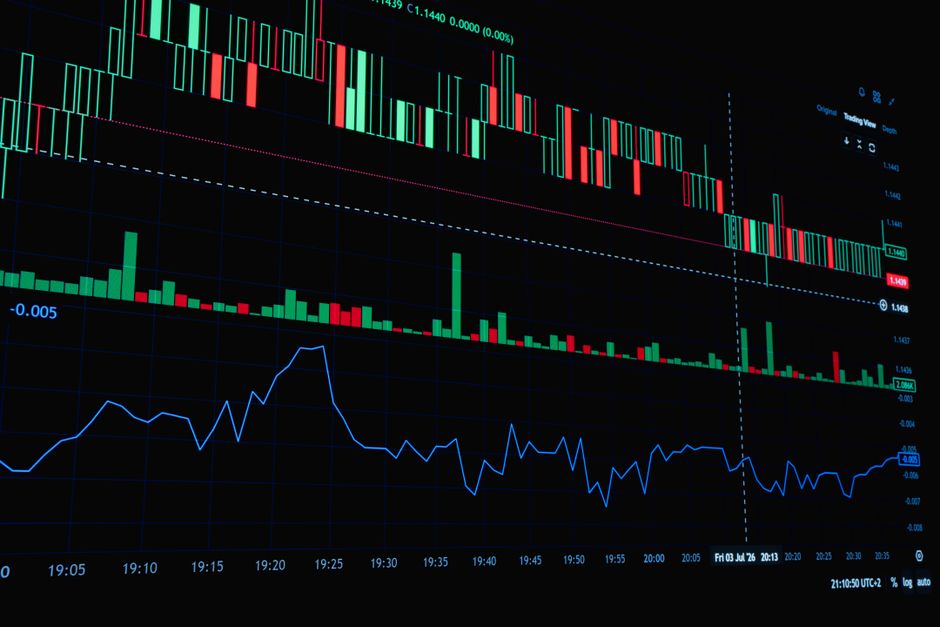
Forty basis points of movement during a typical intraday session represents the baseline for volatility calculations within the data recorded at orb trading sizing niacki regarding position sizing and risk management. A single unit of exposure changes based on the ATR. This method ensures that a stop loss set two ATRs away consumes the same dollar amount regardless of whether the asset is calm or volatile. The math removes the guesswork from the sizing process. Volatility dictates the distance of the stop, and the stop dictates the number of shares. When the ATR expands, the number of shares must contract to keep the risk constant.
The Mechanics of ATR Scaling

Calculating the unit size requires a fixed risk amount per trade. The formula uses the current ATR value multiplied by a multiplier to set the stop distance. For an opening range breakout, the volatility is often higher than the preceding period. If the ATR is five dollars, a two ATR stop is ten dollars. A one hundred dollar risk per trade then requires exactly ten shares. If the ATR drops to two dollars, the stop becomes four dollars. The same hundred dollar risk now requires twenty five shares. The position size adjusts automatically to the market conditions present at the market open. This prevents large losses during high volatility periods.
Timeframe Selection and Volatility

The timeframe selected for the ATR calculation changes the sensitivity of the sizing. Using a 5 minute chart provides a rapid response to sudden spikes in movement. A 60 minute chart provides a smoother, slower adjustment. Most mechanical systems look at the ATR from the first hour of the session to determine the parameters for the rest of the day. The volatility measured during the first fifteen minutes often sets the tone for the subsequent trading hours. A mismatch between the timeframe used for the signal and the timeframe used for the ATR results in inconsistent risk exposure. Consistency requires that the ATR period matches the intended holding period of the trade.
Applying the Calculation to the Opening Range
The opening range provides a specific volatility boundary. When a trade occurs during an opening range breakout, the ATR must reflect the recent expansion of the range. If the fifteen minute range is twice the size of the previous day, the unit size must be halved. The math remains the same. The goal is to maintain a static dollar risk per trade. Measuring the session high and session low helps define the bounds of the current volatility. This data feeds directly into the sizing model to prevent overexposure during the high volume period after the cash open.
Standardizing the Risk Profile
Manual sizing leads to errors. A mechanical approach uses the ATR to dictate the shares. The process ignores the nominal price of the asset. Instead, it focuses on the volatility-adjusted distance. This prevents the error of taking too many shares in a fast-moving market. The volatility-adjusted unit size is the only way to keep the risk profile uniform across different instruments and different times of the day. The math handles the variance so the execution remains consistent.